Bus riders can now lament over just how bad their commutes are with greater accuracy.
A new website launched Thursday, busturnaround.nyc, offers report cards on many local routes in the city as well as testimonials from everyday riders. The reports highlight bus speed, percent of bus bunching, and ridership ranks for each route as a means to raise awareness of the system’s failures.
“Riders who rely on the bus every day know pretty well what the issues of their bus are, but now they can confirm what they’re experiencing with quantitative, system-wide analysis,” said Tabitha Decker, director of research and learning at TransitCenter.
The nonprofit joined up with other advocacy groups, including the Riders Alliance, Tri-State Transportation Campaign and the Straphangers Campaign, to build the site, which serves as an extension of the groups’ joint Bus Turnaround Campaign.
Launched this summer, the campaign hopes to pressure the city and the state-run Metropolitan Transportation Authority to improve a struggling bus network that lost 46 million annual trips between 2010 and 2015, according to a recent city report.
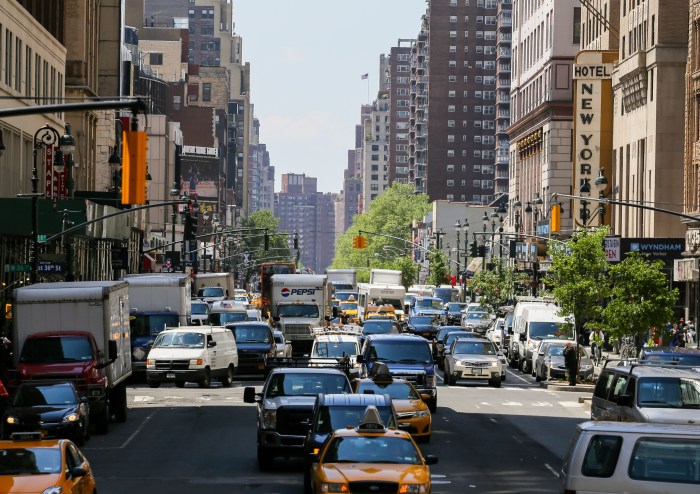
The groups credit the drop in ridership to reduced bus speeds and reliability issues as buses struggle to cut through the congestion of city streets. They’ve proposed a multi-pronged plan to bring more bus lanes, infrastructure and enforcement as well as new technology to help improve service.
The website was built with bus trip data that the MTA releases publicly.
“We saw an opportunity with Bus Time data to do a comprehensive analysis of our bus system,” Decker continued. “Right now, the MTA publicly shares data on 42 key routes. We’ve taken a look at every route in New York City and we’ve given riders digestible data analysis that they can make use of.”
